Available options depend on your version, permissions and hardware. For missing actions, see Security and Diagnostics.
Step by step
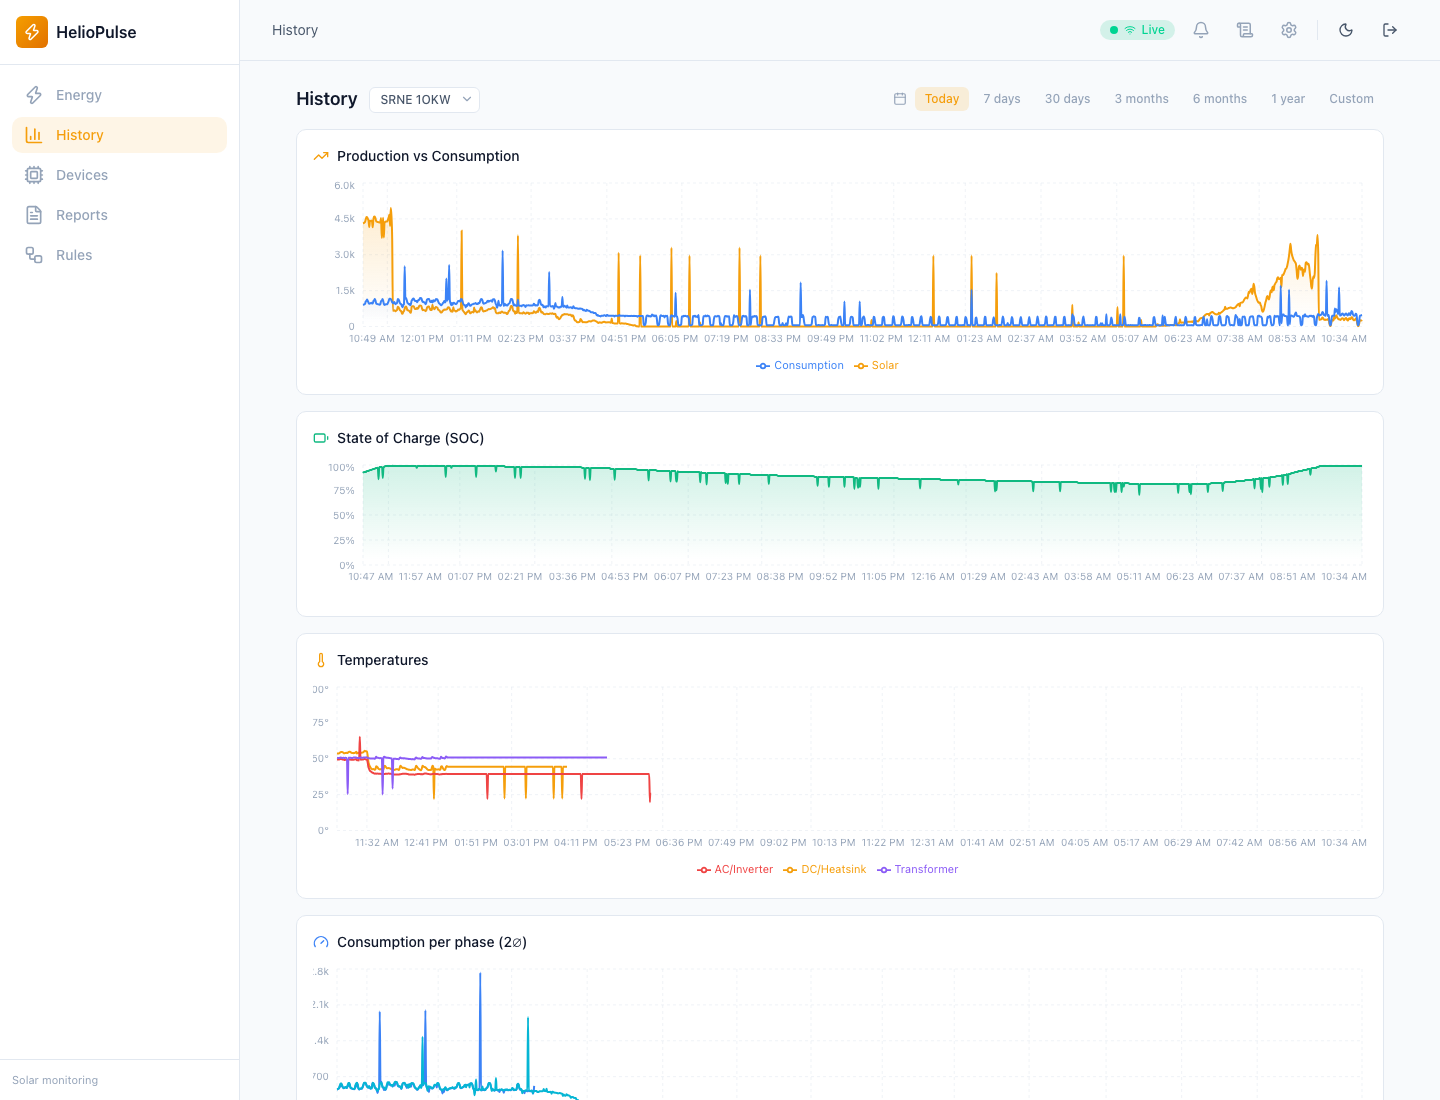
- Choose an inverter or the available combined view.
- Select Today, 7 days, 30 days, 3 months, 6 months, 1 year or Custom.
- For a custom range, enter dates in order and compare the period's charts and summary.
Options explained
- Production and consumption
- locate surplus and peak demand.
- Minimum/maximum SOC
- show charge variation; combined SOC is averaged.
- Temperatures and phases
- appear only when devices report these metrics.
- Impact and savings
- depend on configured price, emissions factor and data coverage.
Troubleshooting
Gaps mean missing samples, not zero consumption. Change dates and check when monitoring began if a period has no data.
Common problems