Available options depend on your version, permissions and hardware. For missing actions, see Security and Diagnostics.
Step by step
- Select the installation or an individual inverter.
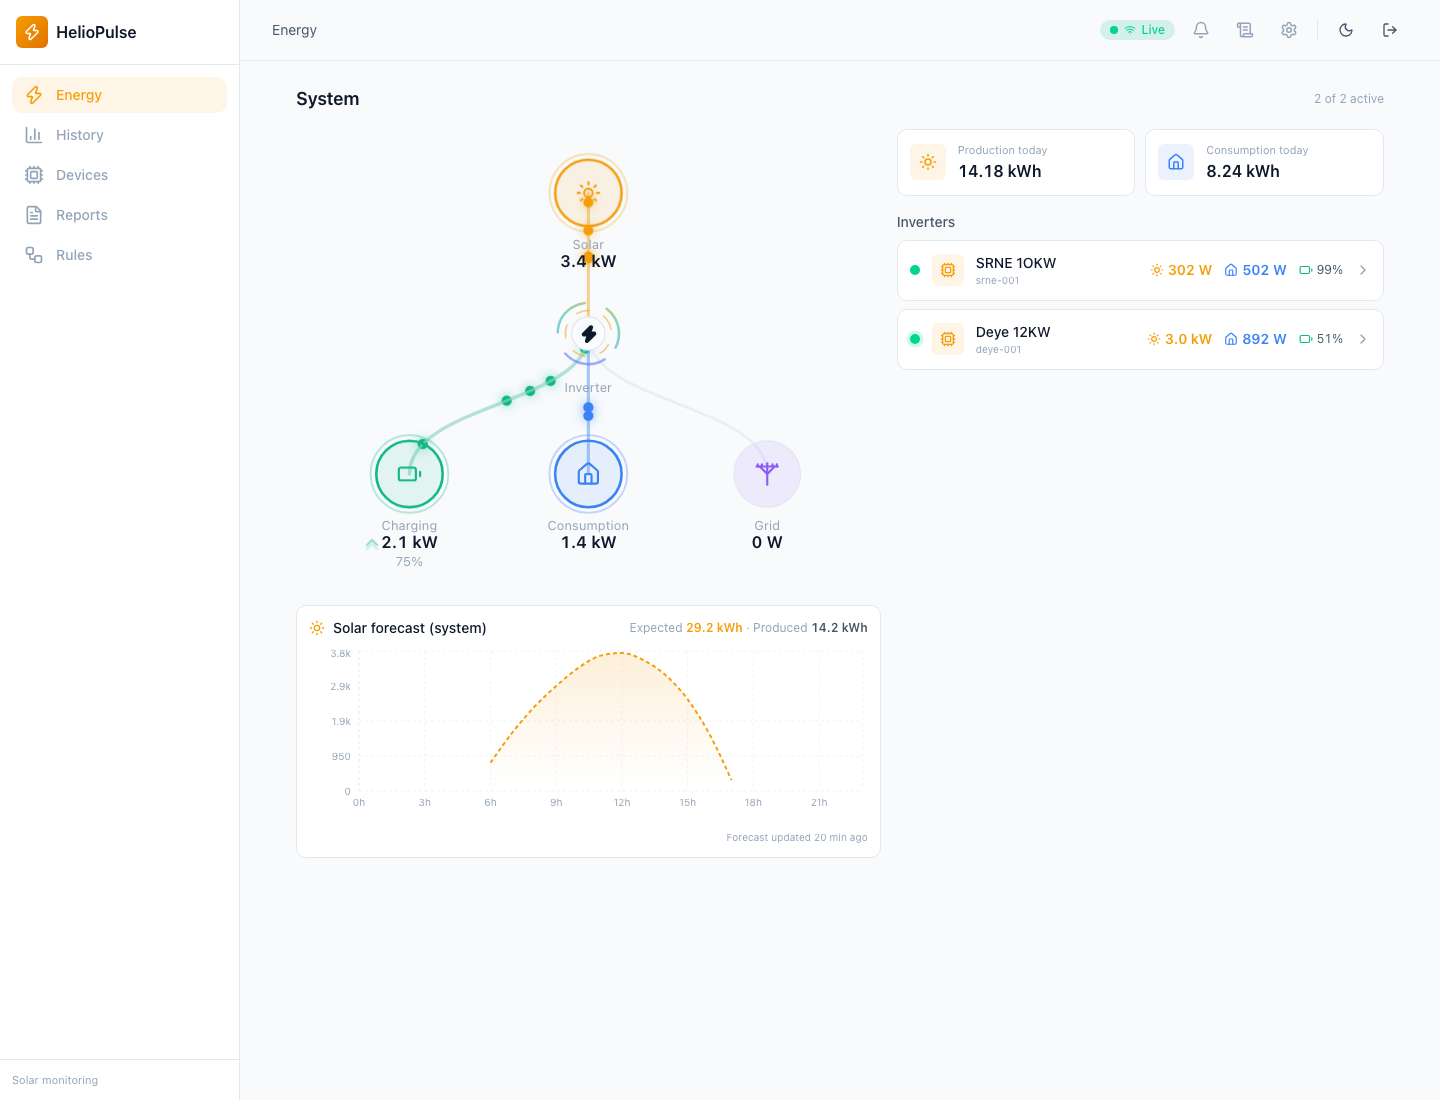
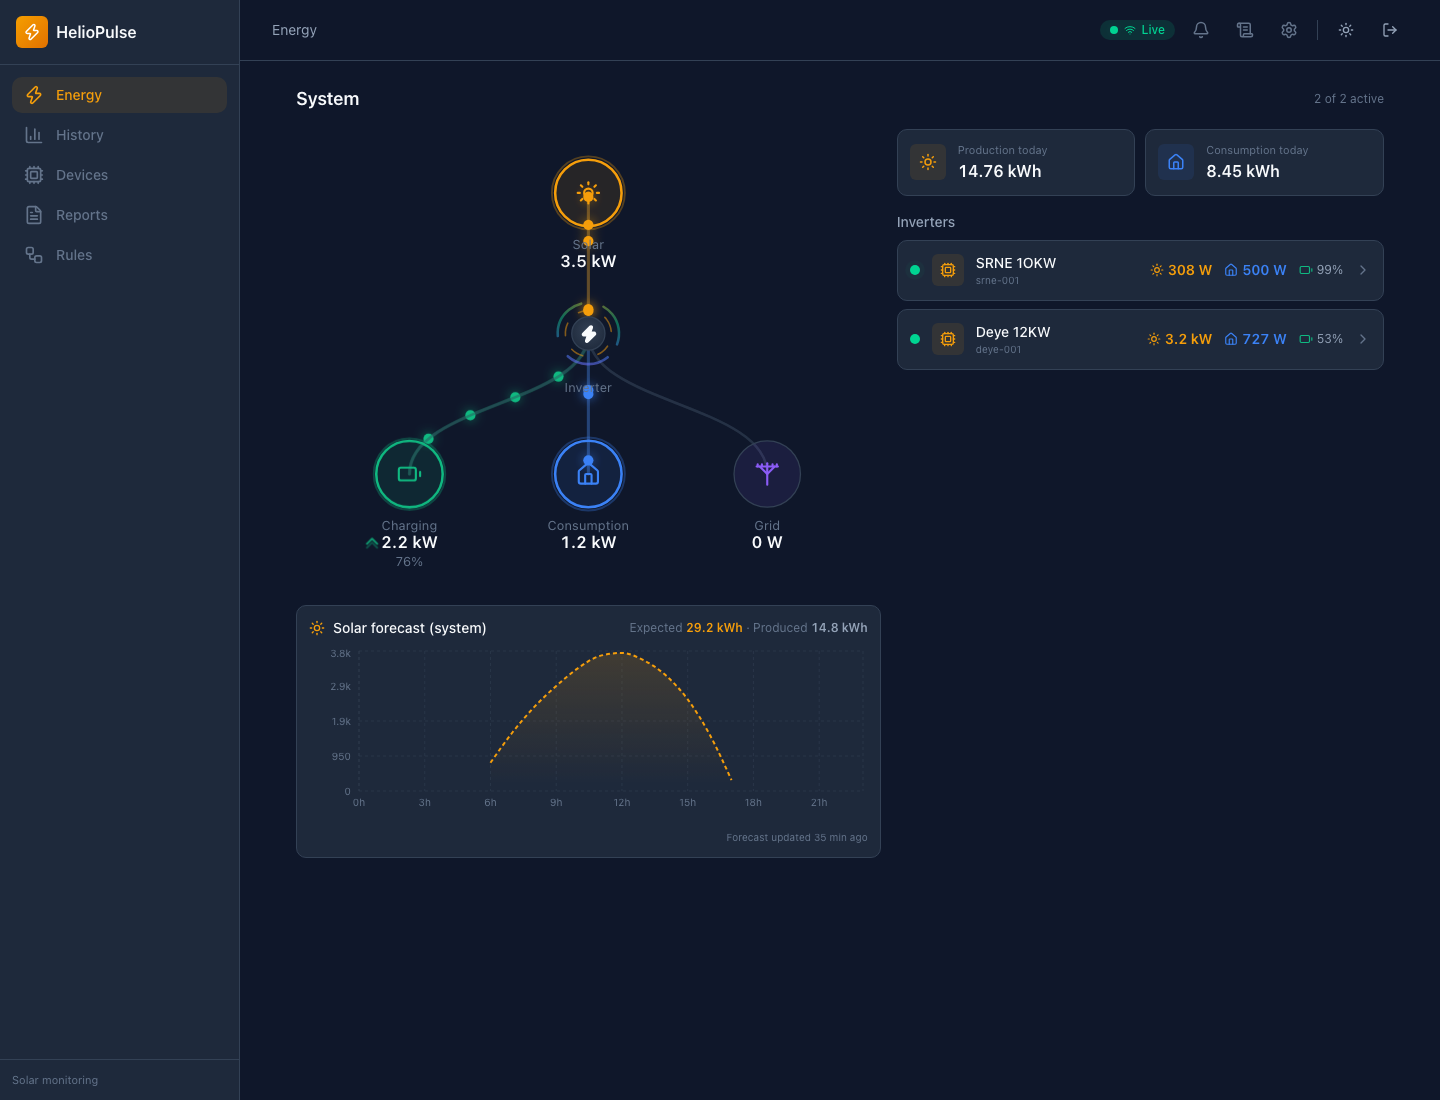
- Read solar production, consumption, battery and grid alongside the energy diagram.
- Compare current values with daily totals and the forecast when available.
Options explained
- Power in W
- instantaneous flow; 1,000 W equals 1 kW.
- Energy in kWh
- accumulated over time; 1 kW for two hours equals 2 kWh.
- Battery
- SOC indicates charge; flow direction distinguishes charging from discharging.
- Grid and forecast
- import/export depend on driver metrics. A forecast is an estimate, not a reading.
- Combined view
- aggregates equipment; missing readings must not be treated as zero.
Troubleshooting
For stale values, check Equipment and Communications. Missing hours of readings can leave daily totals incomplete.
Common problems